DXA (ancillary study)
LASA filenames:
LASACo41 / LASADo41
LASACo42 / LASADo42
Contact: Marjolein Visser
Background
Dual-energy X-ray absorptiometry (DXA) is a radiographic method to assess body composition. The method provides information on bone quality and body composition for the total body as well as specific body regions. The physical concepts of the DXA method are described elsewhere (Pietrobelli 1996).
In a subgroup of the LASA cohort, three DXA scans were obtained at the C-examination and the D-examination: a hip scan, a scan of the lumbar spine, and a whole body scan. The type of scan, regions and variables are listed in table 1. The regions for the total body scan and the hip scan are shown in figure 1 and 2 (pdf, see also below).
Table 1. DXA scans in LASA
| Scan | LASAC exam | LASAD exam | Regions | Variables |
| Hip | N=523 File: LASACo41 |
N=334 File: LASADo41 |
Femoral neck Trochanteric region Inter-trochanteric region Ward’s triangle Total hip |
Bone area (cm2) Bone mineral content (g) Bone mineral density (g/cm2) |
| Lumber spine | N=535 File: LASACo41 |
N=343 File: LASADo41 |
L1 L2 L3 L4 Total lumbar (L1-L4) |
Bone area (cm2) Bone mineral content (g) Bone mineral density (g/cm2) |
| Whole body | N=520 File: LASACo42 |
N=341 File: LASADo42 |
Head Left arm Right arm Left leg Right leg Trunk Total body |
Mass (fat + lean) (g) Fat (g) Lean (includes BMC) (g) Bone area (cm2) Bone mineral content (g) Bone mineral density (g/cm2) |
LASA DXA cohort
LASA respondents living in the Amsterdam region who participated in the C examination (1995/1996) and who were born in or before 1930 (65 years and older as of January 1, 1996) were invited for an additional DXA examination in 1995/1996. Of the 695 respondents who were invited, 535 respondents (77%) participated in the DXA examination of exam C. Non-responders were older but had a similar gender distribution (Pluijm 2001).
Only respondents with a DXA scan at C exam were invited for a repeated DXA scan at D exam (1999/2000).
XA scanner
The DXA scans were conducted at the University Hospital VU, using a Hologic QDR 2000 scanner (Hologic Inc., Waltham, MA, USA). For the whole body scan the selected scanning mode was ‘enhanced array whole body’ and software version V5.70A was used to analyse the scan data (for some respondents early in C exam software version V5.67A was used). For hip scan: ‘array right hip medium’, software version V4.71A:1 (for some respondents early in C exam software version V4.66A:1). For spine scan: ‘array spine medium’, software version V4.71A:1 (for some respondents early in C exam software version V4.66A:1).
Hip scan
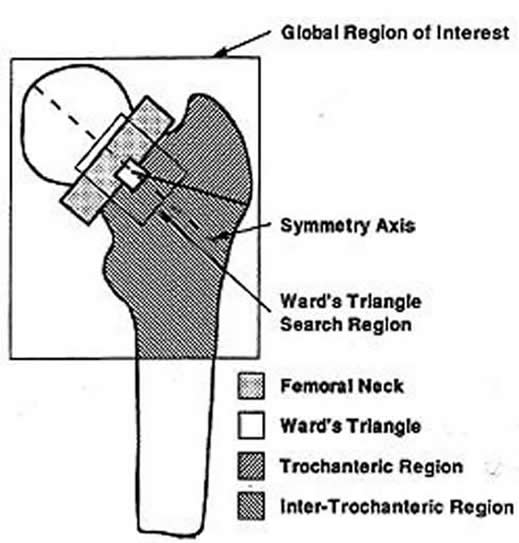
The bone area (AREA, cm2), the bone mineral content (BMC, grams) and the bone mineral density (BMD, grams/cm2) are provided for five hip regions (see figure 1). BMD is calculated as BMC divided by AREA. The Ward’s triangle is a small region of the femur (approximately 1 by 1 cm) which is located automatically by the DXA system at the area of minimum density in the femur.
In LASA, the hip scan was mostly made on the left site of the body (97.6% C exam and 95.8% D exam). If a hip prothesis was present, the right hip was scanned. No hip scan was made in respondents with a bilateral hip prothesis. Please note: for some respondents the right hip was scanned for unknown reasons. The variables CHIPSITE and DHIPSITE in the dataset indicate which site was scanned.
Lumbar spine scan
The bone area (AREA, cm2), the bone mineral content (BMC, grams) and the bone mineral density (BMD, grams/cm2) is provided for five lumbar spine regions: the total lumbar spine, L1, L2, L3 and L4.
Whole body scan
The bone area (AREA, cm2), the bone mineral content (BMC, grams), the bone mineral density (BMD, grams/cm2), the fat mass (FAT, grams), the lean mass (LEAN = fat-free soft tissue + bone mineral content, grams), and the total mass (MASS, grams) is provided for each region of interest (ROI) and the total body (figure 2).
The amount of total body fat mass (kg) or the percent body fat (fat mass / body mass *100, %) can be used as indicators of body fatness or level of obesity. The amount of fat-free soft tissue (LEAN minus BMC) of the extremities can be used as an indicator of skeletal muscle mass (Visser 2000, Pluym 2001) and has been validated in young and older persons (Visser 1998, Wang 1996). The coefficient of variation of DXA body composition measurements is: total body fat (2-3%), total body lean (1-2%), arm skeletal muscle mass (3-4%), leg skeletal muscle mass (2-3%), appendicular skeletal muscle mass (2-3%) (Figuerora 1998, Fuller 1992, Economos 1997).
Joint protheses can influence BMC measurements. To a lesser extend they will also influence the LEAN and FAT estimates. The influence of a prothesis on total body estimates is likely to be small, but a considerable bias in ROI data may occur. The presence and location of a prothesis (knee and hip) is indicated by two separate variables in the dataset (CKNE_PRO and CHIP_PRO for C exam, DKNE_PRO and DHIP_PRO for D exam) .
For several respondents parts of the body were not completely visible in the field of scanning. The body parts most frequently affected are the left arm and the head. In addition, for some respondents the lines to separate two ROIs were placed incorrectly. For all these respondents, an indicator variable (CFLAG or DFLAG) was created. A complete list of flagged scans, the respondent number, the detected problem, and advice for data analysis is given in table 2ab (pdf, C exam) and table 3 (pdf, D exam).
For two respondents at C exam (12460, 16704) and two respondents at D exam (12209, 12660) a whole body scan was made but the soft tissue results were not calculated.
Two general remarks regarding the use of data in statistical analysis are made. The amount of skeletal muscle mass, and to a lesser extent the amount of fat mass, is strongly determined by body height (longer arms and legs contain more muscle). Also, muscle mass is strongly determined by total body fat (the muscles are needed to support the extra weight). When appropriate, adjust for height and total body fat in the regression models.
Calculation of 3-year change variables
Repeated scans (C and D exam) at the hip are available for 336, spine for 343 and whole body for 334 respondents. Make sure to compare only hip scans that were made on the same side of the body. Example: the left hip was scanned at C exam. The respondent obtained a left hip prothesis during follow-up. Because of prothesis at left hip, the right hip was scanned at D exam. Thus, for this person no change in bone quality at the hip can be calculated. Make sure to compare similar whole body scans. Example: The left arm was not completely scanned during the D exam (out of scanning field). Two times the information from the right arm was used to calculate arm skeletal muscle. To calculate change in arm muscle, also use two times right arm at C exam for this person.
Examples in using change data of appendicular skeletal muscle mass within LASA can be obtained in the following papers: Visser 2003, Schaap 2006.
References
- Economos CD, Nelson ME, Fiatarone MA, Dallal GE, Heymsfield SB, Wang J, Yasumara S, Ma R, Vaswani AN, Russell-Aulet M, Pierson RN. A multi-center comparison of dual-energy X-ray absorptiometers: in vivo and in vitro soft tissue measurement. Eur J Clin Nutr 1997;51:312-7.
- Figueroa-Colon R, Mayo MS, Treuth MS, Aldridge RA, Weinsier RL. Reproducibility of dual-energy X-ray absorptiometry measurements in prepubertal girls. Obes Res 1998;6:262-7.
- Fuller NJ, Laskey MA, Elia M. Assessment of the composition of major body regions by dual-energy X-ray absorptiometry (DEXA), with special reference to limb muscle mass. Clin Physiol 1992;12:253-66.
- Pietrobelli A, Formica C, Wang Z, Heymsfield SB. Dual-energy X-ray absorptiometry body composition model: review of physical concepts. Am J Physiol 1996;271:E941-51.
- Pluijm SMF, Visser M, Smit JH, Popp-Snijders C, Roos JC, Lips P. Determinants of bone mineral density in older men and women: body composition as mediator. J Bone Min Res 2001;16:2142-51.
- Pluijm SMF, Van Essen HW, Bravenboer N, Uitterlinden AG, Smit JH, Pols HAP, Lips PTA. (2004). Collagen type I alpha1 Sp1 polymorphism, osteoporosis and intervertebral disc degeneration in older men and women. Annals of the Rheumatic Diseases, 63, 71-77 (See also Thesis Pluijm 2001).
- Schaap LA, Pluijm SMF, Deeg DJH, Visser M. Inflammatory Markers and Loss of Muscle Mass (Sarcopenia) and Strength. Am J Med 2006;119:526.e9-17.
- Visser M, Fuerst T, Salamone L, Lang T, Harris TB. Validity of fan beam dual-energy x-ray absorptiometry for measuring fat-free mass and leg muscle mass. J Appl Physiol 1999;87:1513-1520.
- Visser M, Deeg DJH, Lips P, Harris TB, Bouter LM. Skeletal muscle mass and muscle strength in relation to lower-extremity performance in older men and women. J Am Geriatr Soc 2000;48:381-6.
- Visser M, Deeg DJH, Lips P. Low vitamin D and high parathyroid hormone levels as determinants of loss of muscle strength and muscle mass (Sarcopenia): the Longitudinal Aging Study Amsterdam. J Clin Endocrinol Metab 2003;88:5766-72.
- Wang Z, Visser M, Ma R, Baumgartner RN, Kotler D, Gallagher D, Heymsfield SB. Skeletal muscle mass: evaluation of neutron activation and dual-energy X-ray absorptiometry methods. J Appl Physiol 1996;80:824-831.
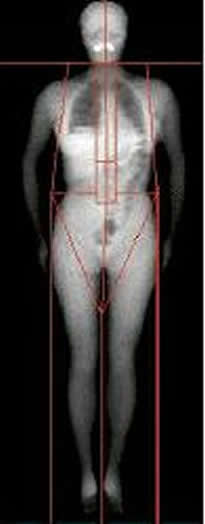
| Figure 1. Regions of whole body scan |
Figure 2. Regions of hip scan (proximal femur) |
Date of last update: March 16, 2009