Dementia algorithm
Contact: Almar Kok
Background
LASA does not include diagnosis of dementia based on clinical testing, such as in cerebrospinal fluid or with PET-scans. However, LASA does includes repeated measurements of several cognitive tests and has various other sources that provide strong indications of dementia. By combining these data sources, van den Kommer et al. (1) developed an algorithm that indicates the probability of dementia in LASA respondents at each measurement wave. In 2021, the algorithm was updated.
The algorithm uses the following data (Figure 1):
– MMSE‘s (Mini-Mental State Examination, a screening test for dementia (2)), including the shortened telephone version of the MMSE from respondents who could not participate in the full interview (from the-wave onwards);
– IQCODE with proxies of respondents who could not be interviewed themselves (Informant Questionnaire on Cognitive Decline in the Elderly (3));
– Data from General Practitioners (GPs), who indicated for each respondent whether a diagnosis of dementia was made by the GP and/or a specialist;
– Relevant information listed by interviewers on the respondent contact forms (RCF’s);
– Data on whether respondents lived in a psycho-geriatric nursing ward, which would be a strong indication of dementia; and
– Information about cause of death, where dementia could be indicated as the cause.
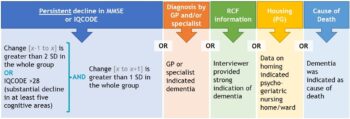
Figure 1. Data sources included in the LASA dementia algorithm
Measurement instruments in LASA
For the waves C to I, a variable is available that, based on the sources mentioned above, indicated whether dementia is likely to be present. The variable has six categories:
Category 0 No dementia
Category 1 Dementia at wave x
Category 2 Dementia at the previous wave (x – 1)
Category 3 Undetermined: no data at subsequent wave(s), meaning that persistent MMSE decline could not be examined
Category 4 Undetermined: no persistent decline, yet MMSE score <=18
Category 5 Undetermined: inconsistent or contradictory data
More information on the algorithm rules is given in Figure 1 and available here.
Based on the algorithm spanning waves C-I, n=356 participants were identified with probable dementia. When including the undetermined categories, then n=593.
Variable information
LASAZPD
(pdf)
Availability of information per wave ¹
| B | C | D | E | 2B* | F | G | H | 3B* | MB* | I | J* | K* | ||
|---|---|---|---|---|---|---|---|---|---|---|---|---|---|---|
| Dementia algorithm | - | X | X | X | X | X | X | X | - | - | X |
¹ More information about the LASA data collection waves is available here
* 2B=baseline second cohort;
3B=baseline third cohort;
MB=migrants: baseline first cohort;
J, K=under construction
Previous use in LASA
Van den Kommer, Deeg, van der Flier, & Comijs (2018) found that based on the dementia algorithm, here labelled ‘Persistent Cognitive Decline (PCD)’, the incidence of dementia ranged from 2,5% to 3,4% per LASA-wave. They found an increase in PCD incidence over time, which was not explained by well-known dementia risk factors.
References
- Van den Kommer TN, Deeg DJH, Van der Flier WN, Comijs HC (2018). Time trend in persistent cognitive decline: results from the Longitudinal Aging Study Amsterdam. Journals of Gerontology: Social Sciences, 73: S1, S57-S64.
- Folstein MF, Folstein SE , McHugh PR (1975). Mini-mental state: a practical method for the clinician. Journal of Psychiatric Research, 12, 189-198.
- Jorm AF, Korten AE (1988). Assessment of cognitive decline in the elderly by informant interview. British Journal of Psychiatry, 152, 209–213.
Date of last update: September, 2022